Multidimensional
equity grading
Ambition
The multi-equity map currently only assesses the ambition of countries’ first NDC.
Five equity assessmentsratio Greenhouse development rights Capability Equal
cumulative per capita Equal
per capita
Country
ratio Greenhouse development rights Capability Equal
cumulative per capita Equal
per capita
| 2030 | |||
|---|---|---|---|
| CER | .. | [.. to ..] | |
| GDR | .. | [.. to ..] | |
| CAP | .. | [.. to ..] | |
| CPC | .. | [.. to ..] | |
| EPC | .. | [.. to ..] | |
| 2050 | |||
|---|---|---|---|
| CER | .. | [.. to ..] | |
| GDR | .. | [.. to ..] | |
| CAP | .. | [.. to ..] | |
| CPC | .. | [.. to ..] | |
| EPC | .. | [.. to ..] | |
Fairness statement contained in NDC
Description of fairness
Description of ambition
Description of how it contributes towards achieving the objective of the Convention
Conditionality of the NDC
Last updated
Fairness statement downloaded on October 28th 2016 from:
WRI, CAIT Climate Data Explorer. 2016. CAIT Paris Contributions Map. Washington, DC: World Resources Institute. (http://cait.wri.org/indcs/).
The original
NDCs and
NDCs submitted so far are hosted on the UNFCCC website.
Temperature goal
The Paris Agreement states an aim of:
“Holding the increase in the global average temperature to well below 2°C above pre-industrial levels and pursuing efforts to limit the temperature increase to 1.5°C above pre-industrial levels, recognizing that this would significantly reduce the risks and impacts of climate change”
The global emissions scenarios were selected (from the IPCC database and a peer-reviewed study1) to align with the Paris Agreement goals. These scenarios include emissions from land-use and international aviation and shipping, and have the following features:
-
global emissions peaking by 2020,
-
global net-zero emission by 2100,
-
at least a likely (>66%) chance of limiting global warming to below 2 °C for the rest the century,
-
a subset of 1.5 °C, scenarios with a more likely than not (>50%) chance of returning to below 1.5 °C of warming in 2100.
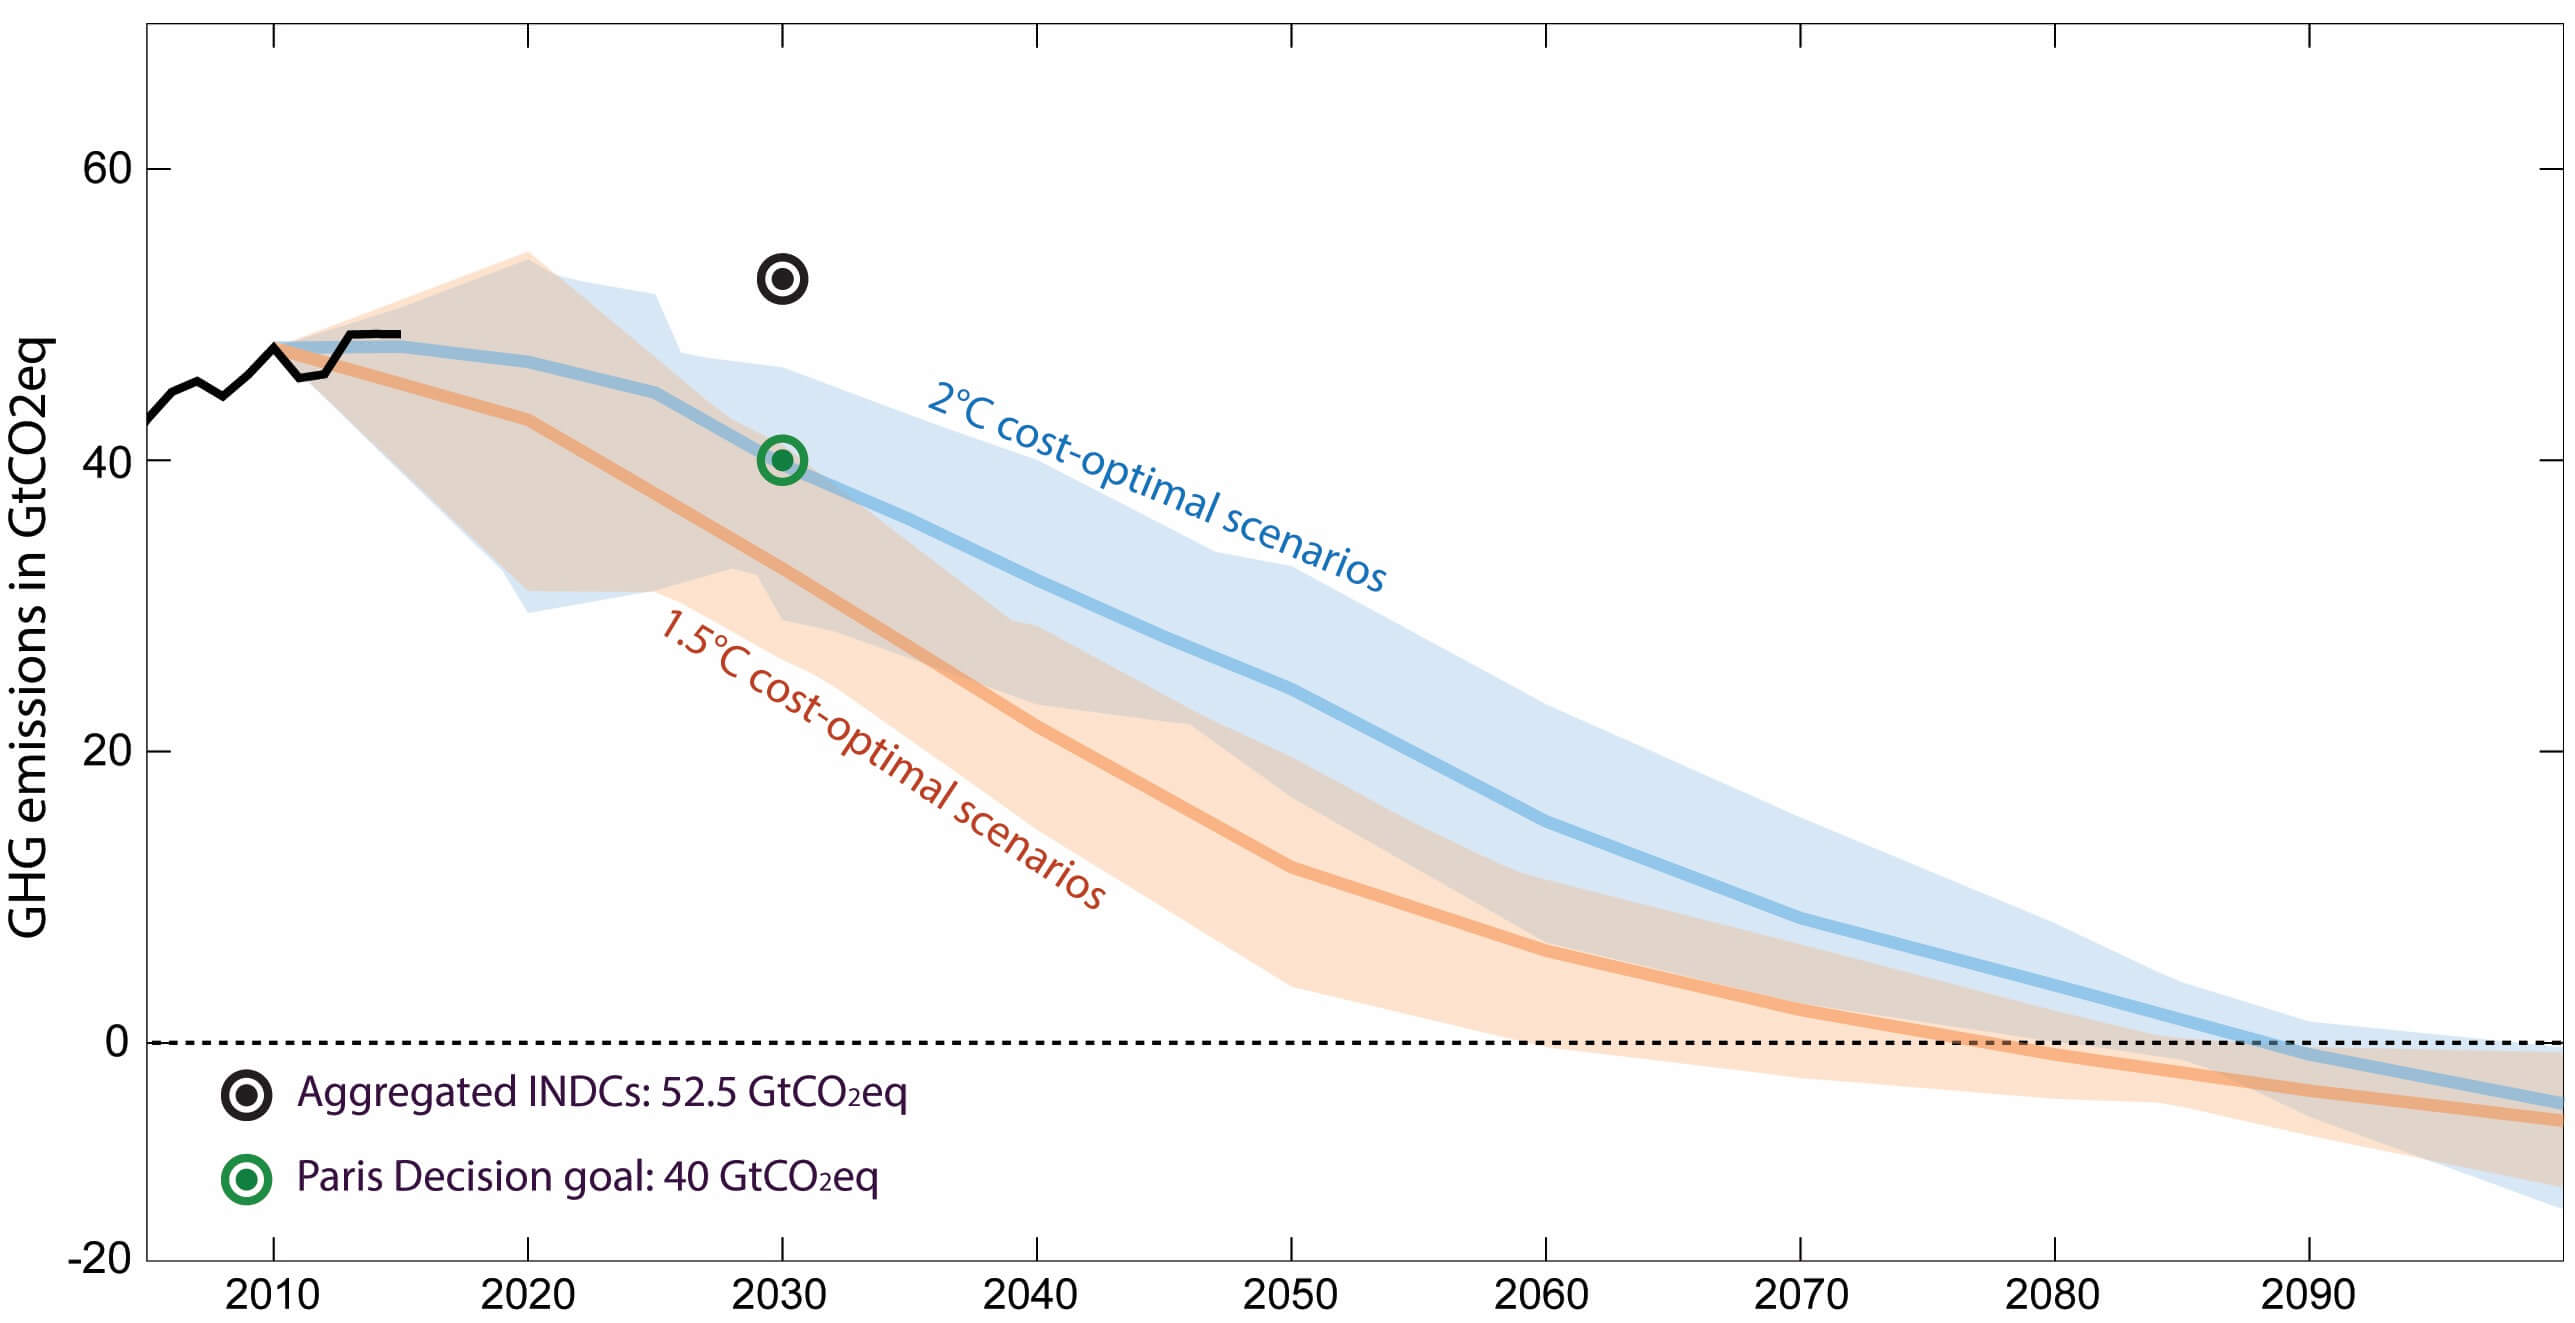
Range and average of global cost-optimal emissions scenarios, including land-use and bunker emissions, consistent with the Paris Agreement goals.
References
1 Rogelj, J. et al. Energy system transformations for limiting end-of-century warming to below 1.5 °C. Nat. Clim. Chang. 5, 519–527 (2015).
Five equity assessments
National emissions allocations are quantified following the five equity categories presented in the IPCC-AR5 WGIII Ch. 6 (figure 6.28). The methodology is detailed in this study, and the formula and parameterization available here. Each of these allocation approaches allocates the emissions of the cost-optimal scenarios presented in the “Temperature goal” section, but exclude emissions from the land-use sector and from international aviation and shipping. The national equitable emissions allocations presented in this website can be met with a combination of domestic mitigation, internationally traded emissions mitigation and support towards global mitigation.
The consistency of national contributions can be checked with each of the five equity categories. This can be compared with countries’ statements on the fairness of their contributions.
|
Allocation name |
Code |
Allocation characteristics |
||
|---|---|---|---|---|
|
Constant emissions ratio |
CER |
Staged approaches |
Maintains current emissions ratios, preserves status quo. |
|
|
Greenhouse Development Rights |
GDR |
Responsibility-capability-need |
Countries with high GDP per capita and high historical emissions per capita have low emissions allocation.
|
|
|
Capability |
CAP |
Capability |
Countries with high GDP per capita have low emissions allocations. |
|
|
Equal cumulative per capita |
CPC |
Equal cumulative per capita |
Populations with high historical emissions have low emissions allocations.
|
|
|
Equal per capita |
EPC |
Equality |
Convergence towards equal annual emissions per person in 2040. |
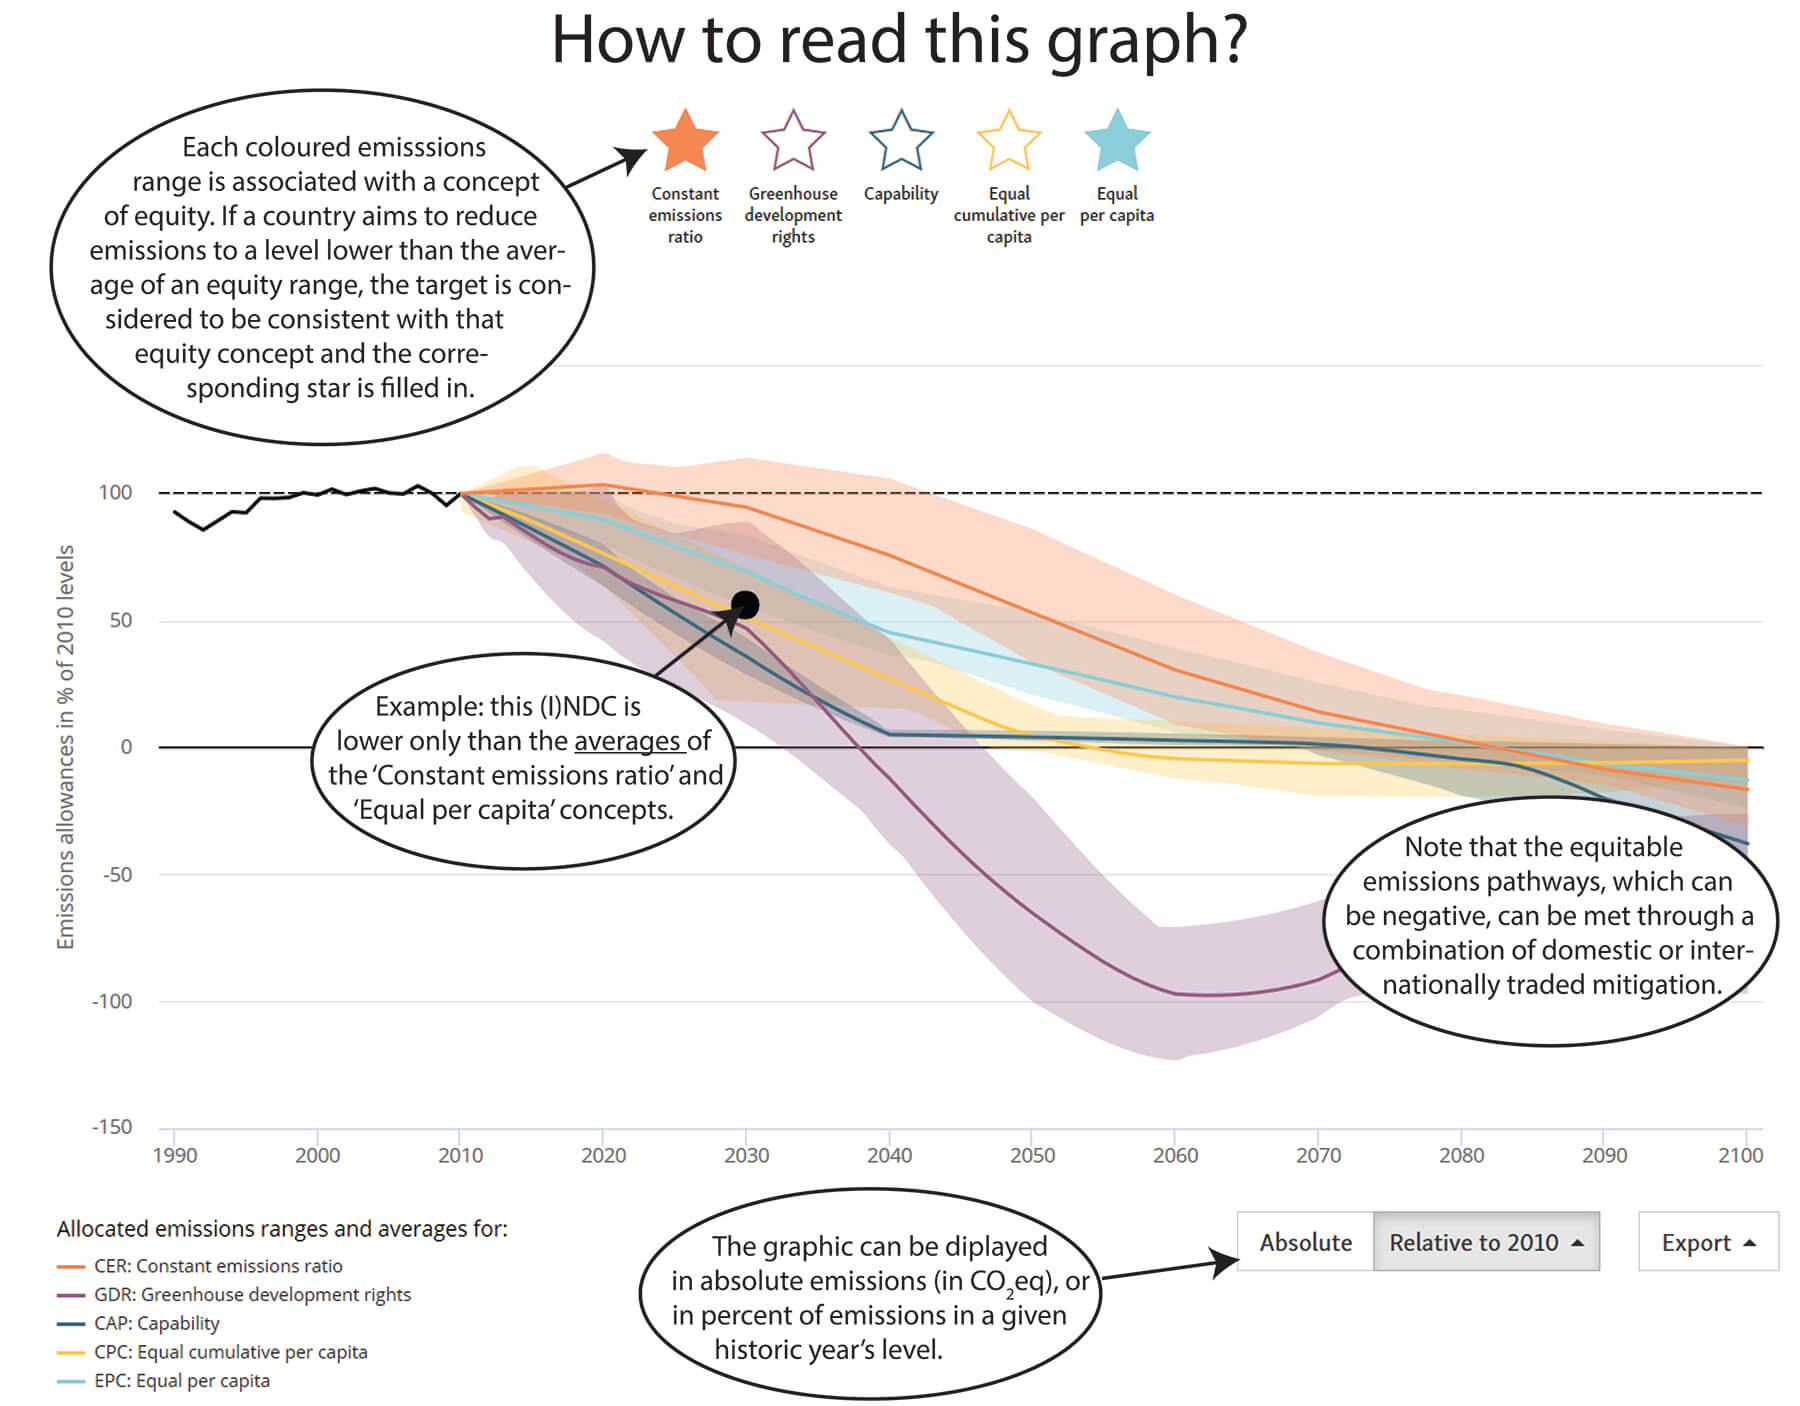
How fair are countries' climate pledges?
This Equity Map presents an assessment of countries’ climate pledges under five visions of climate justice and for emissions pathways that are consistent with the Paris Agreement goals of limiting warming to 1.5 °C or well below 2 °C, and achieving net-zero greenhouse-gas emissions by the end of the century.
The Equity Map shows how many of the five visions of equity are met by each country’s 2030 pledge. The number of stars given to each country corresponds to the number of visions of equity met by its Nationally Determined Contribution. A country with a higher number of stars can be considered ambitious according to more visions of equity, and is therefore likely to be considered ambitious by a greater number of countries. However, it would not appear ambitious according to the visions of equity that are not matched, and as such could not be considered as universally ambitious.
The consistency of national contributions can be checked with each of the five equity categories individually. This consistency can be compared their statements on the fairness of their contributions. Is a country’s pledge sufficiently ambitious according to the vision of equity supported in its national communication or NDC (see section ‘Fairness statement in NDC’ below country graphs)?
A report based on the website’s data compares the equity performances of each G20 country’s climate pledges against their own declarations on equity.
Clicking on a country will show a country graph with the corresponding equitable national emissions pathways, under each of the five equity concepts, as well as the country’s declaration regarding the fairness of its pledge. The results table indicates which emissions mitigation target (in 2030 or 2050) a country should take to be consistent with its statement.
The methods behind the modelling of the equitable emissions allocations can be found in the “The Science”.